
In 2016, economists projected an 8.4% GDP growth rate for Uganda attributed to oil production. There were a lot of preparations in anticipation. Uganda’s GDP growth has been volatile attributed to the ever-changing macro-economic dynamics.

The key GDP drivers are services (52%), agriculture (23%) and industry 25%.
Tourism and diaspora remittances contribution to GDP at the US $1.3 billion and 1.5billion respectively are key drivers. In 2016, Uganda had announced about the US $ 10 to 12 billion investment in upstream oil development activities. However, something happened and the final investment decision (FID) by the government, remains hanging.
GDP growth continues to stagnate attributed to uncertainties during Uganda’s political cycles, specifically elections. While the early periods of the 21st century showed great promise as the private sector gained centre stage, this progress was affected in the second decade. Any gains in economic growth are affected by political uncertainties. The 2016 Uganda general elections delivered a big blow to the economy with GDP recording a mere 3.6% growth rate following the riots and Internet blackout that characterized that election.
Now some oil companies are scaling down activities, terminating some employees. This is worrying. Why is this happening at a time the world is setting timelines for clean energy? Even more worrying is the Corona Virus (COVID-19) threats. What impact will it have on Uganda that relies heavily on tourism now that the country is being locked down?
Can Uganda survive a double impact of Covid-19 and political elections or the voting should be postponed until the economy recovers? Analysis of figure 1 shows that Uganda’s GDP growth falls during the election year. Take note of 1996 (GDP growth fell to 5.1% from 9.07%), then 2001 (GDP fell to 8.5% from 10.78%), and in 2011 when it fell to 3.84% from 9.39% and most recently in 2016 that saw it go down under to 3.86% from 4.78%.
Securities bubble during important political cycles
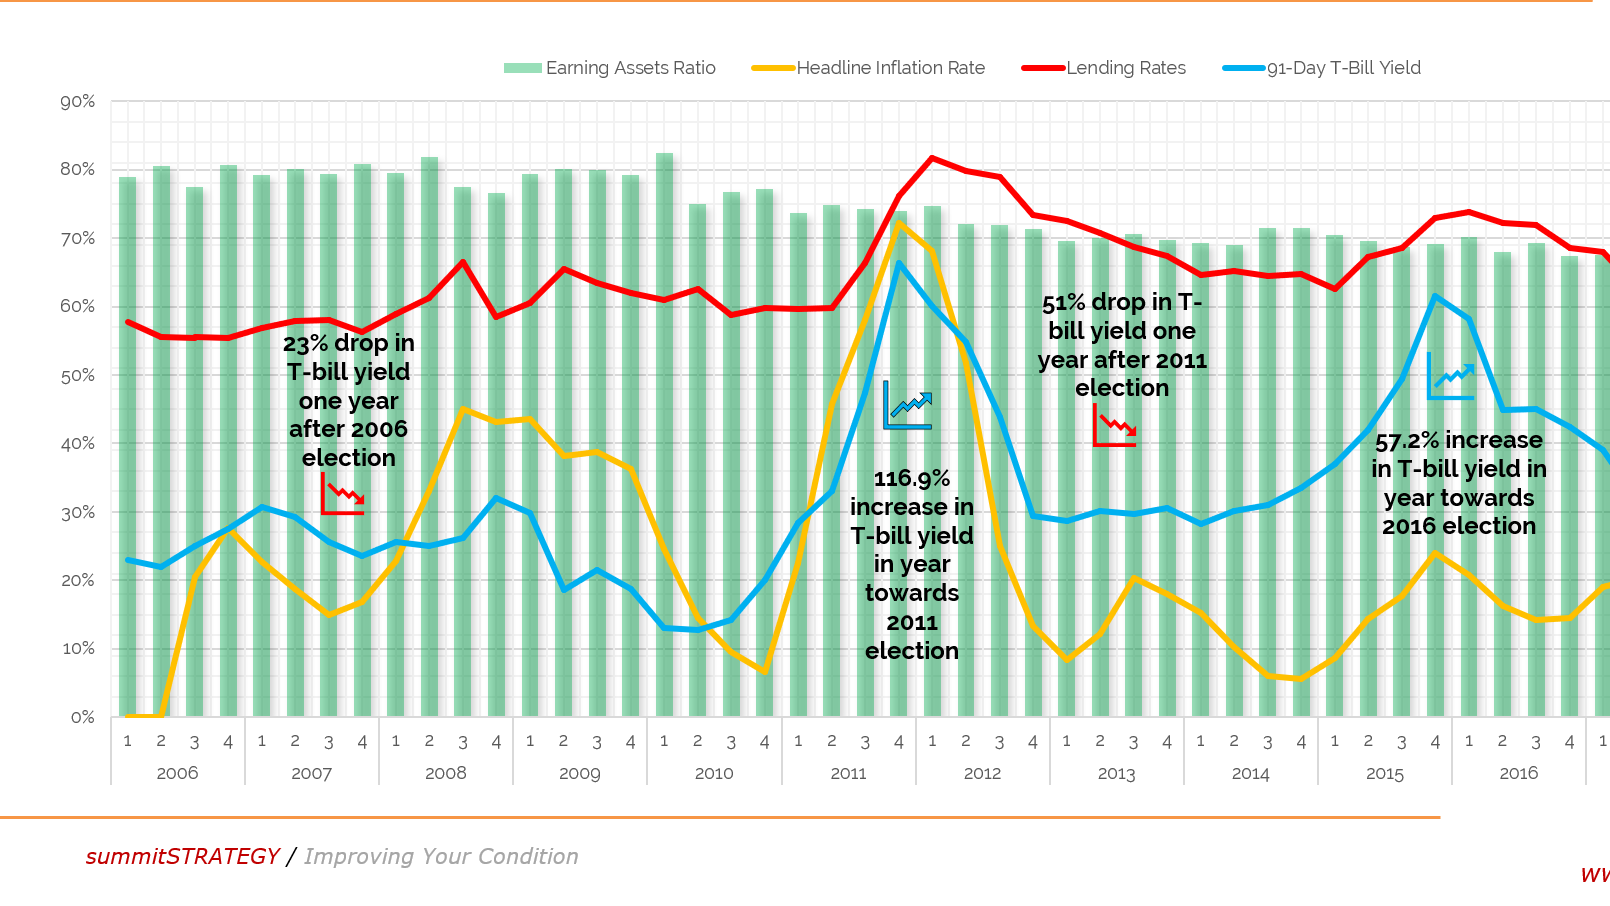
Summit Consulting Ltd did an 18-year trend analysis that shows a bubble in the preceding year of elections which is attributed to the incumbent’s incentive to stimulate the economy, through both fiscal and monetary policy, to augment the ruling party’s chances of being re-elected. There has been a persistent fall in the yield of the common 91-day T-bill of more than 32% towards 2018 since the 2016 election. Similarly, the fixed deposit rate average has fallen by 3% in the same period. This has reduced the overall appetite to save which will subsequently increase the yields on these securities and investment bourses. Consequently, we expected reduced activities at the Uganda stock exchange due to key fundamentals moving the wrong way.
What plans does the government have in store to shove off COVID-19 and the 2021 elections without leaving a dent on the economy?
What do you suggest the government should do?
What are the right policy options in this situation?
Copyright Mustapha B Mugisa, 2020. All rights reserved.



0 comments
Leave a comment