
Most people overcomplicate problem-solving. They fix symptoms, not causes,
that’s why issues keep recurring.
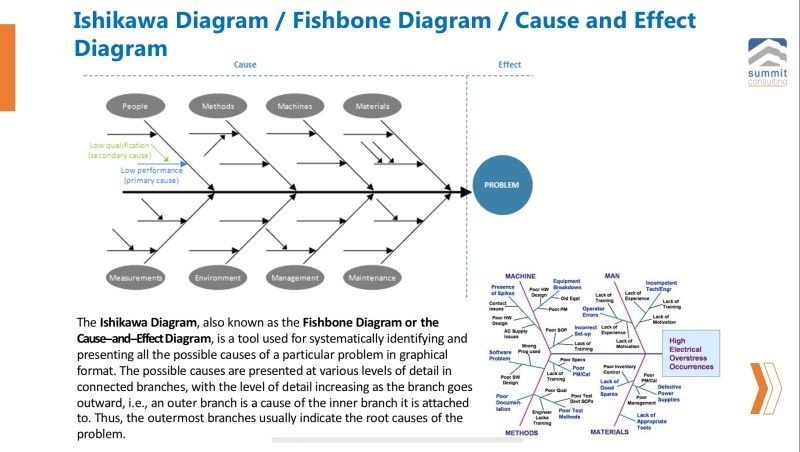
Enter the Cause and Effect Diagram, also known as the Ishikawa Diagram or Fishbone Diagram, this is a tool for those who actually want results. It makes the 5-Whys meaningful by helping to dig deeper in a structured way.
It forces you to stop guessing and map out the real causes of a problem. You don’t just throw solutions at the wall. You break down the problem into categories, dig deep, and expose the root causes.
When to use it?
1) When problems keep resurfacing despite multiple fixes.
2) When you need to pinpoint inefficiencies in processes.
3) When brainstorming solutions with a team.
4) When diagnosing quality issues in production or service delivery.
How to use the tool…
1. Define the problem
Write the problem clearly on the right side of a whiteboard, paper, or software. Be specific.
2. Draw the “fishbone” structure
Create a horizontal arrow pointing to the problem. Draw diagonal branches (like fishbones) leading to this arrow. Each represents a major cause category.
3. Identify key cause categories
Use the 6Ms (for manufacturing) or 4Ps (for service industries):
a) 6Ms-Man, Machine, Method, Material, Measurement, Markets (Environment.)
b) 4Ps-People, Process, Policies, Place.
4. Brainstorm possible causes
For each category, ask “Why?” repeatedly (5 Whys method). Don’t settle for surface-level reasons.
5. Analyze and prioritize root causes
Some causes are symptoms of deeper issues. Identify patterns and prioritize causes that have the biggest impact.
6. Take action
Solve the root cause, not just the symptoms. Implement changes, monitor impact, and adjust as needed.
A case in point:
A factory has high defect rates. Instead of blaming workers, they use a Fishbone Diagram and find the root causes:
1. Man, Poor training.
2. Machine, Equipment calibration issues.
3. Method, Inefficient quality checks.
4. Material, Low-grade raw materials.
5. Markets-poor market segmentation and profiling.
Once they fix these root causes, defects drop by 60%.
Mr. Strategy’s insight:
Stop firefighting employees’ problems. They don’t disappear unless you tackle the root causes. The Cause-and-Effect Diagram makes you think, not assume. Use it when you want permanent solutions, not quick fixes.
Are you a leader? Challenge your team to tackle complex issues using this tool.
Want more insights, inbox.


0 comments
Leave a comment